Interactive Map Prototype
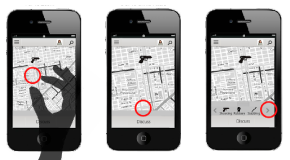
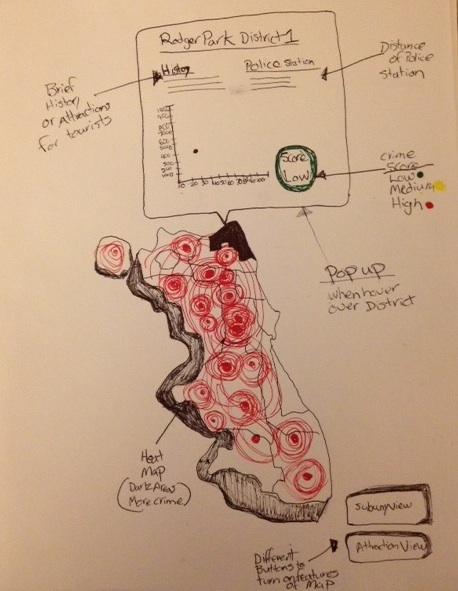
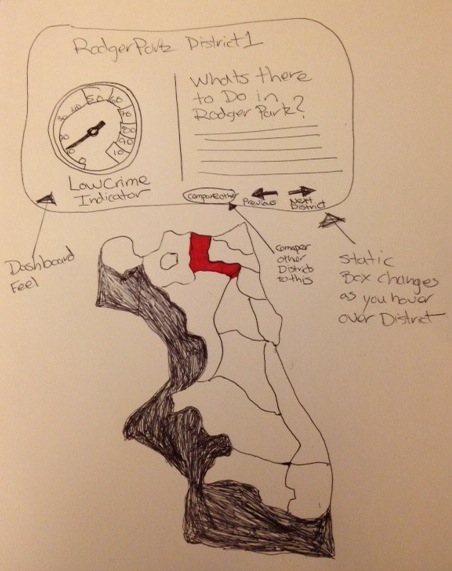
Interactive Map Sketch Ideas
Wireframes with Annotations Ideas
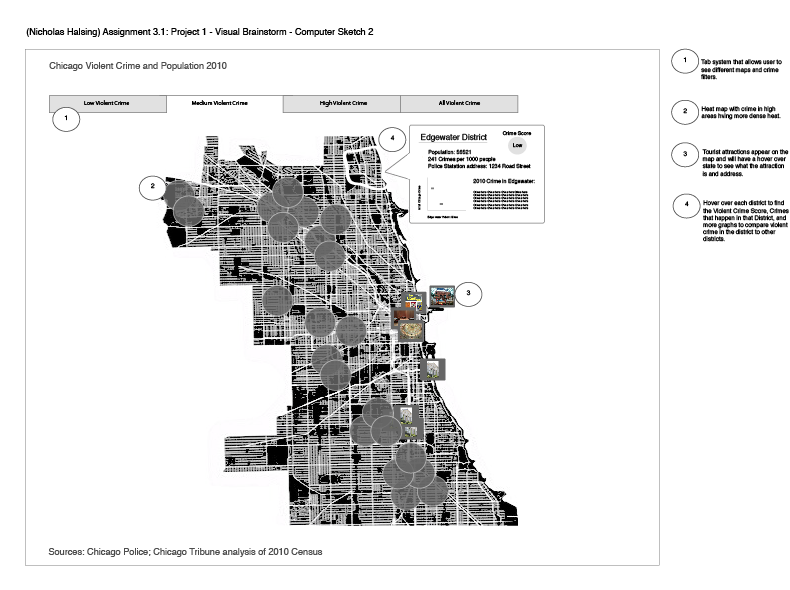
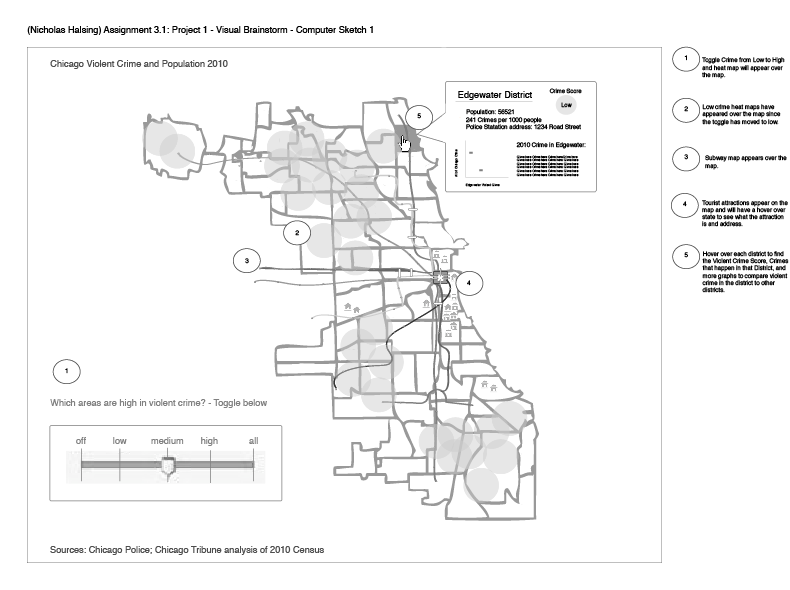
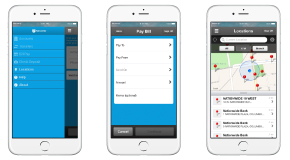
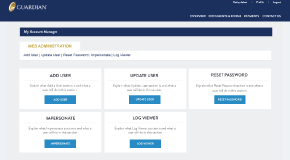
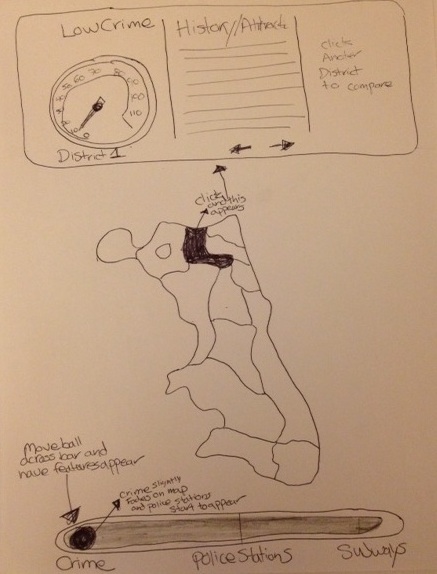
Second Round of Visual Design
Final Round of Visual Design and Interaction
Portfolio
Work Information:
Tools: Adobe Illustrator, Adobe Photoshop, Adobe Flash
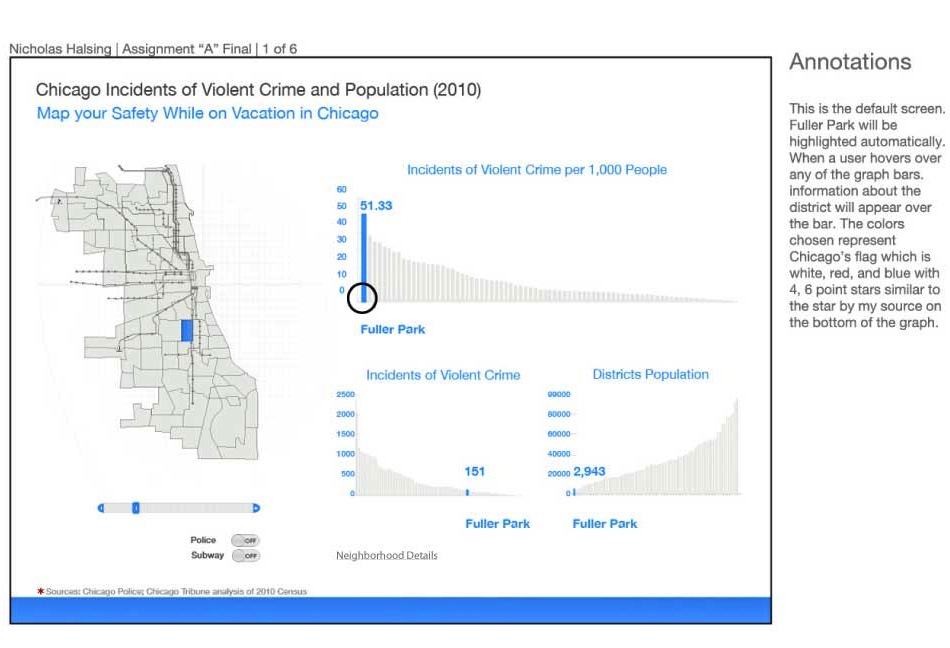
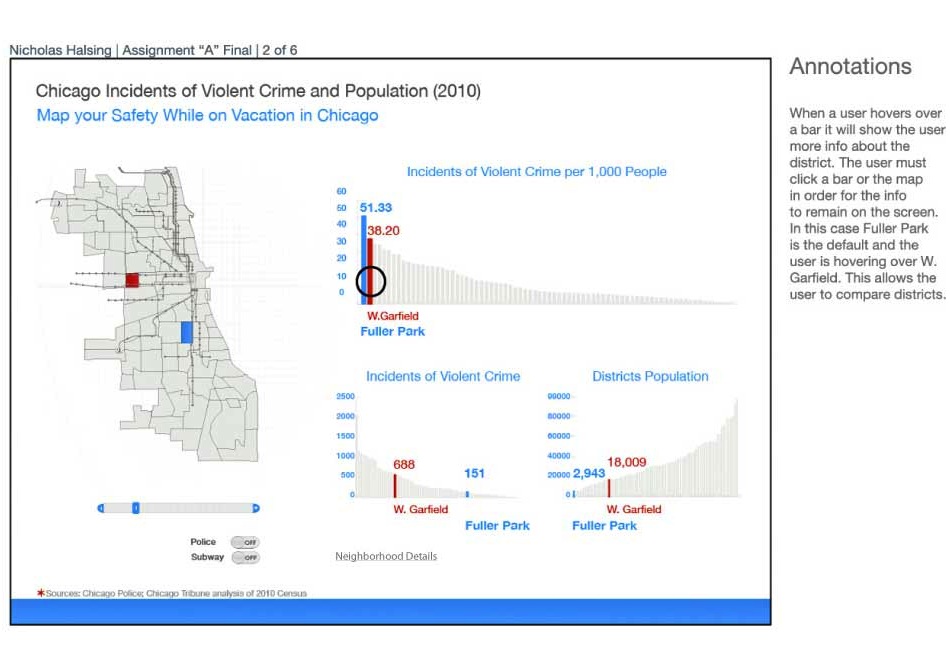
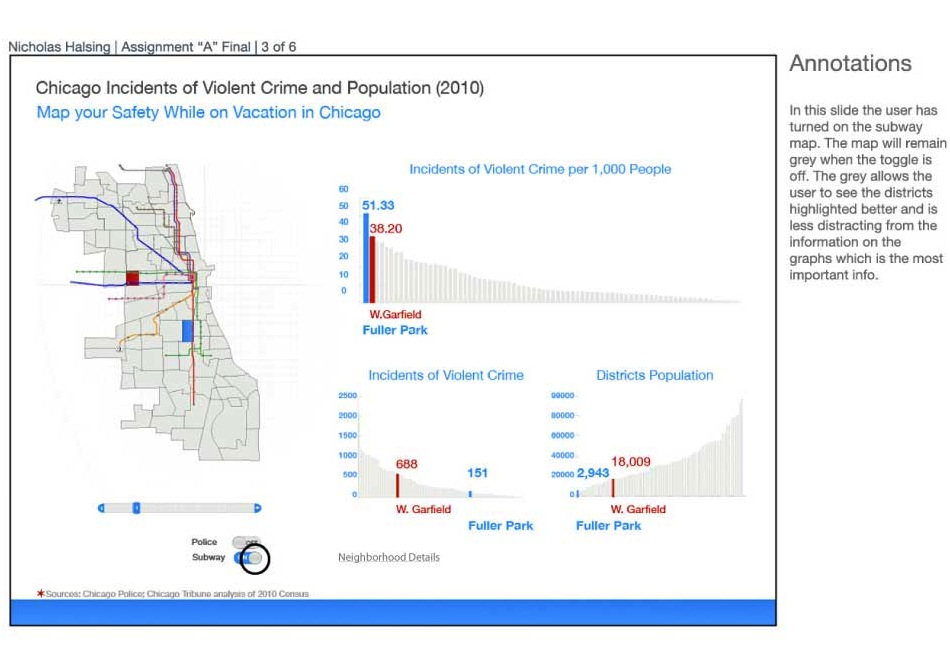
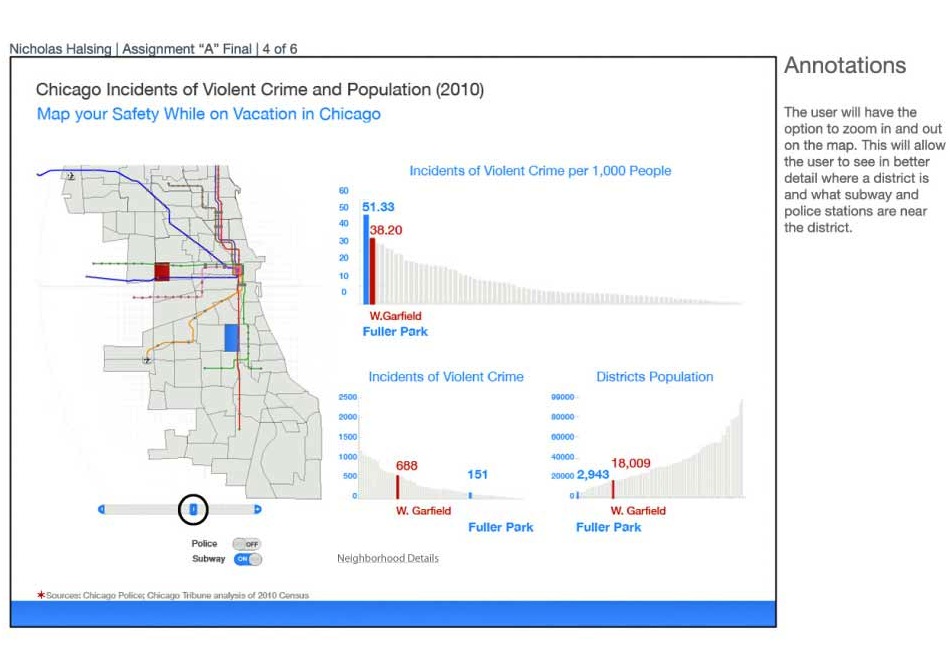
DESCRIPTION:
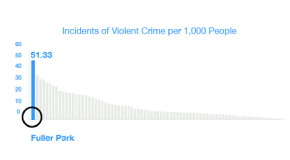
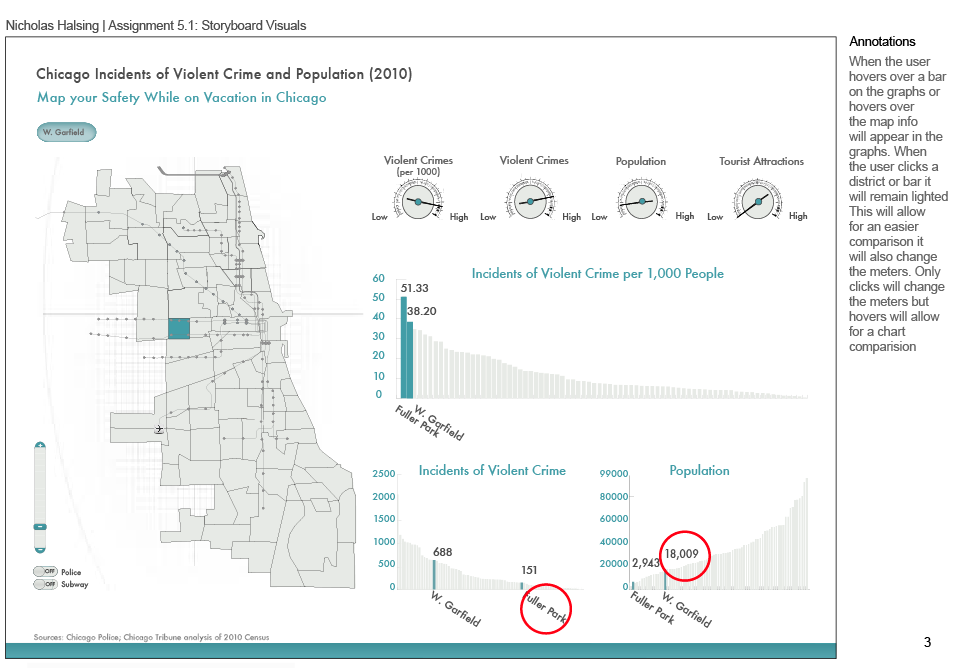
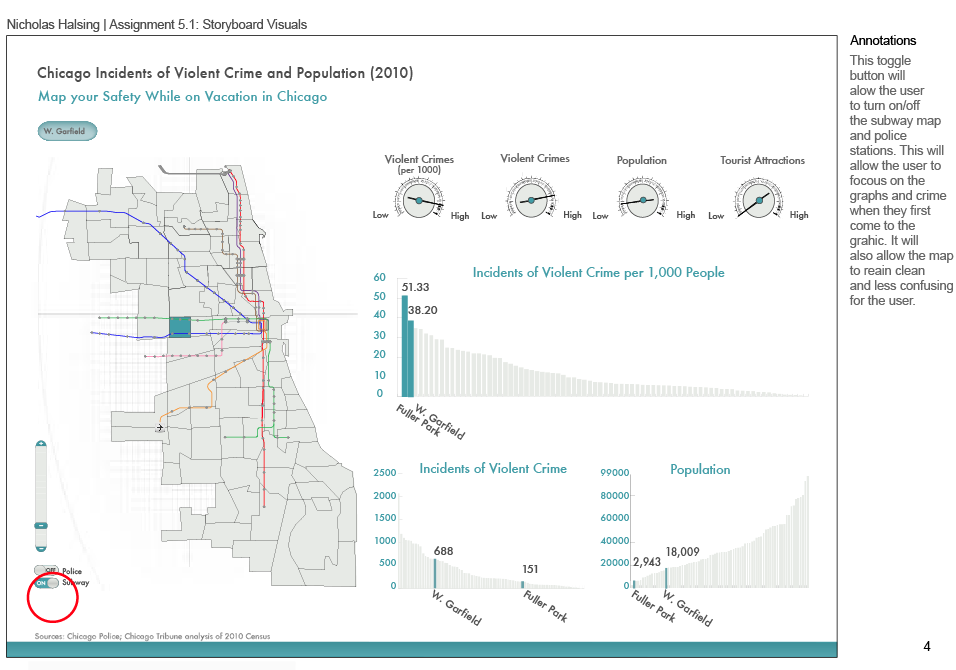
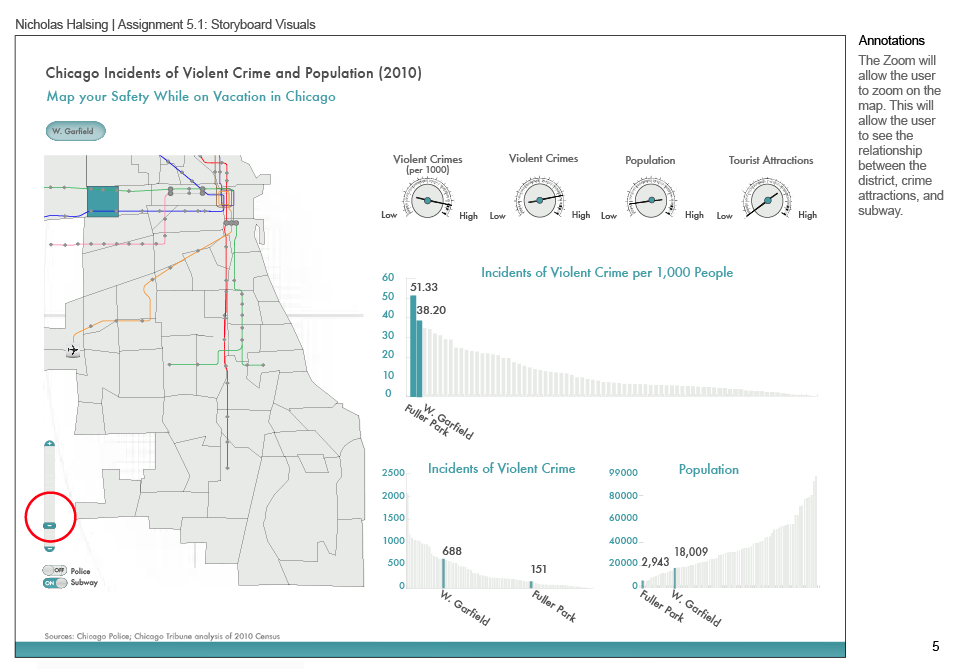
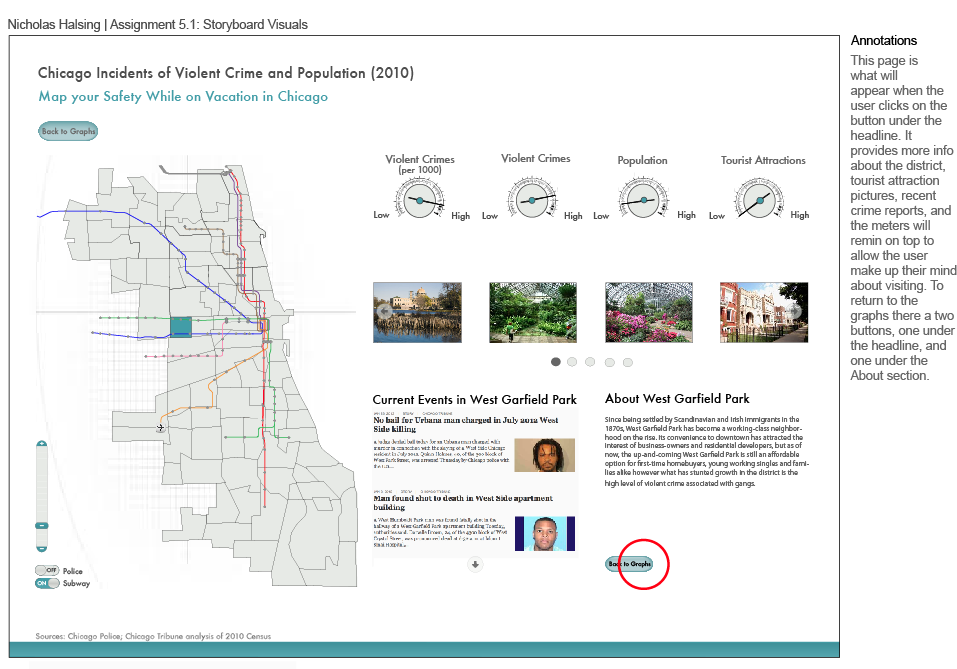
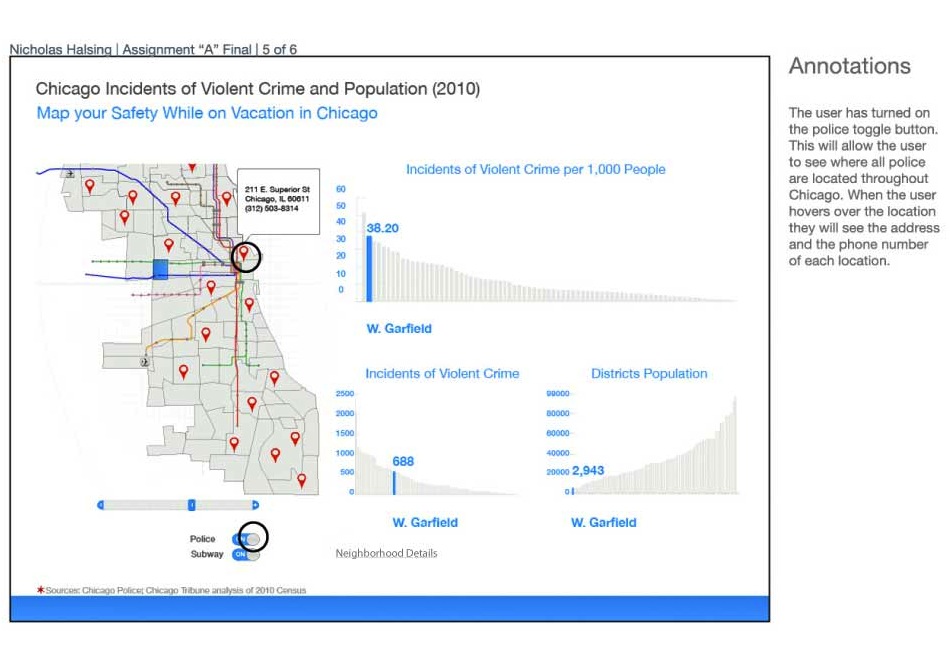
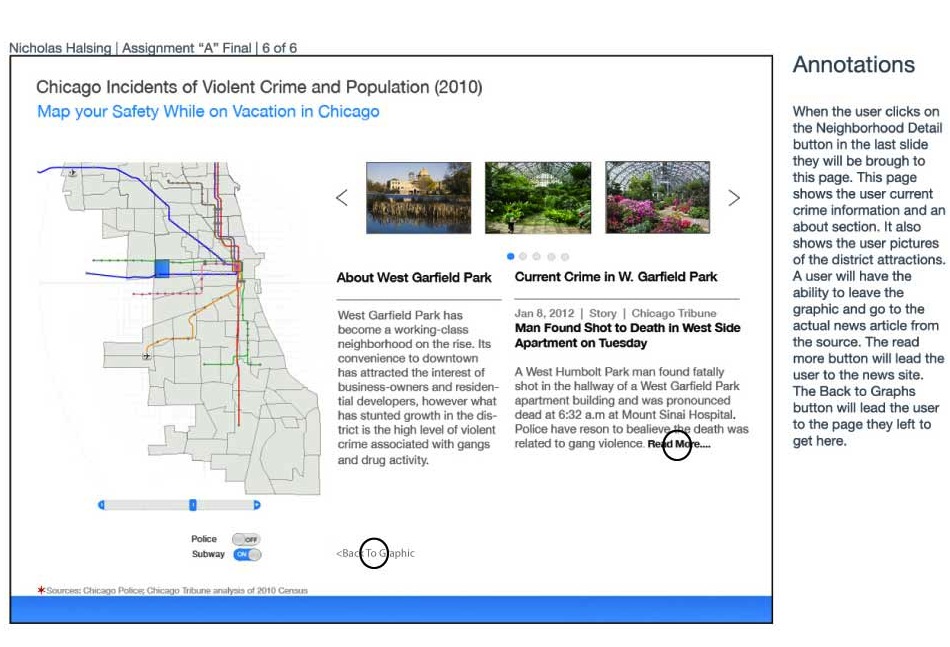
This interactive infograph was created using the Chicago Police Census data. It was important to look at all the data and find trends and anything worthy of creating an infographic. In analyzing the data I found particular districts close relation to subways, police stations, and tourist attractions may have effected rates of incidents of violent crimes. In the second round of visual designs I started to create too much "chart junk" with the crime meters which distracted users from the important information. The button to the next page of the infographic in the second visual design was confusing for users and in the final design all actions were grouped close to each other. The final design incorporated a new font which is easier to read, a more relevant color scheme, and a change in the way users could read the information on the graphs and map.